Track your agent’s performance and customer engagement across your store.
Time Range
Choose a time period to analyze your data.
- 7 Days
- 30 Days
- 90 Days
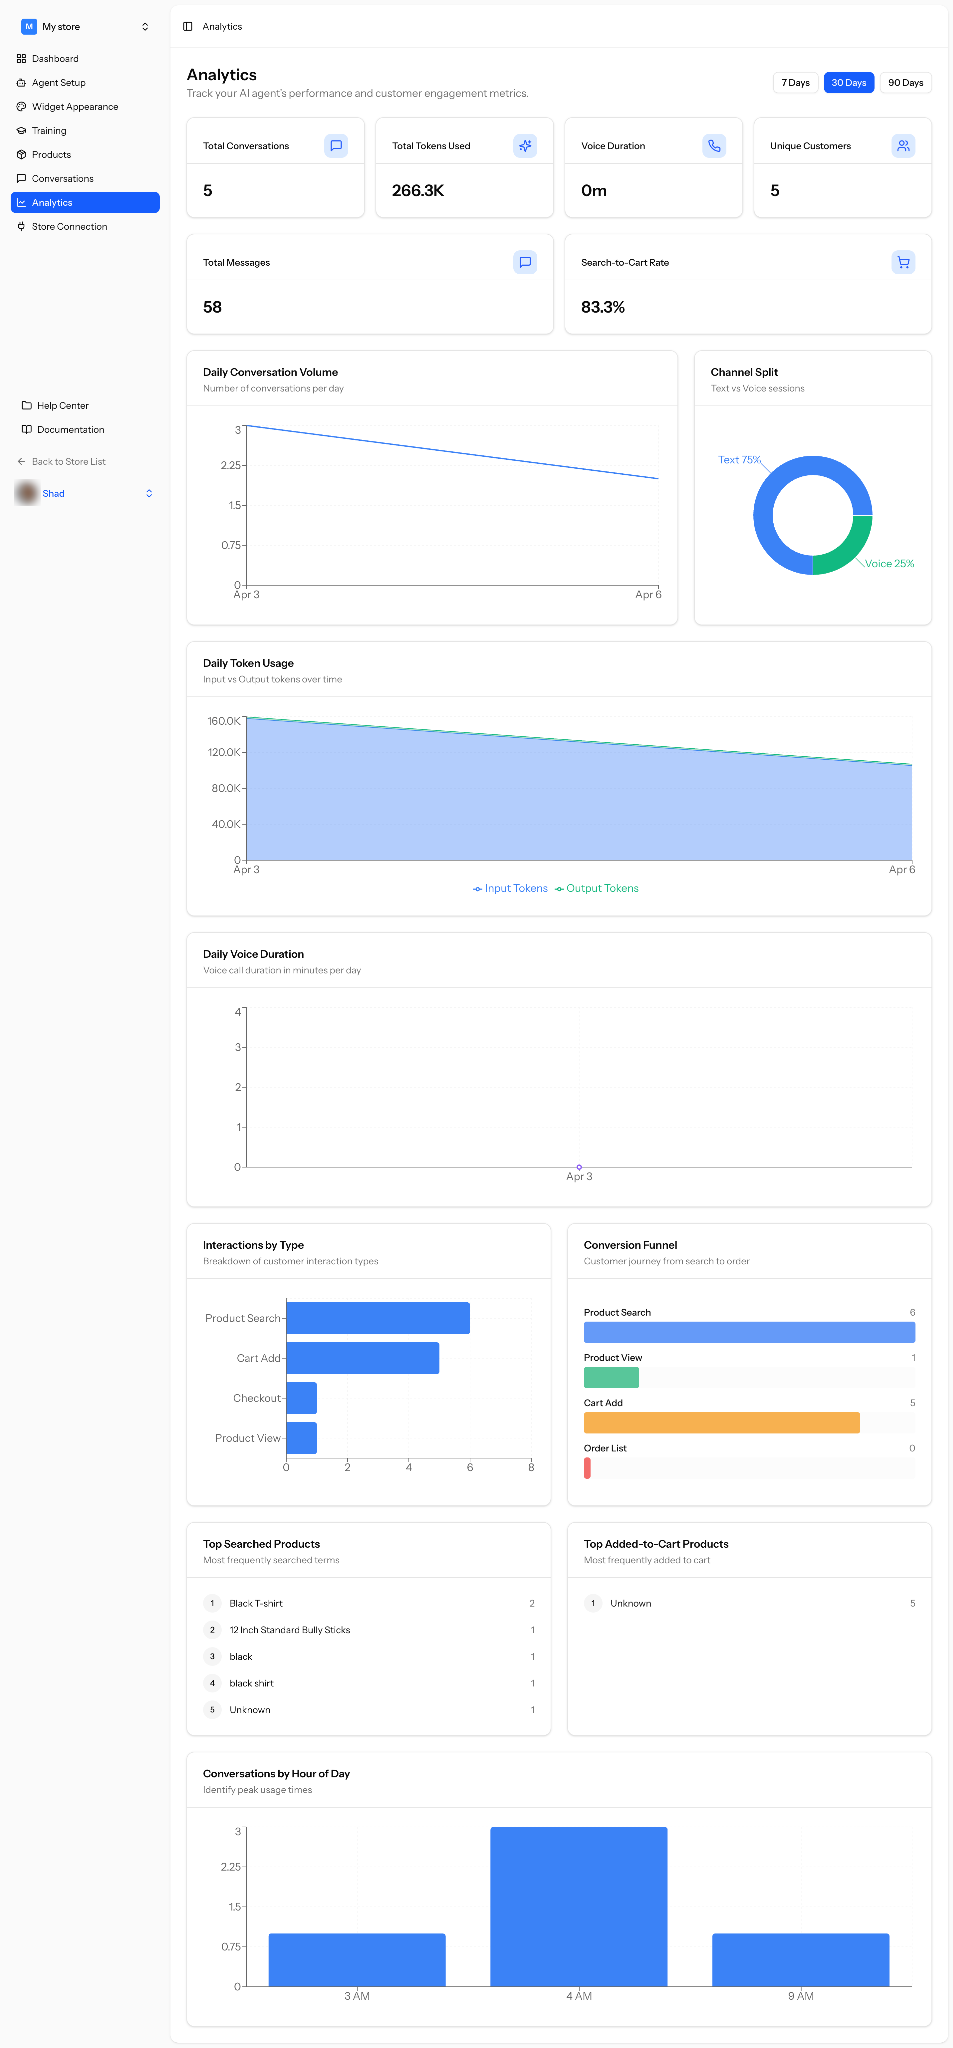
Overview Metrics
Quick snapshot of your agent activity.
- Total Conversations
Total number of customer conversations. - Total Tokens Used
Total AI usage based on input and output tokens. - Voice Duration
Total time spent in voice interactions. - Unique Customers
Number of individual customers who interacted with your agent. - Total Messages
Total messages exchanged between customers and the agent. - Search-to-Cart Rate
Percentage of product searches that resulted in adding items to cart.
Conversation Trends
Understand how conversations change over time.
- Daily Conversation Volume
Number of conversations per day.
Token Usage
- Daily Token Usage
Track input vs output tokens over time.
Voice Insights
- Daily Voice Duration
Track voice interaction duration per day.
Customer Behavior
Understand how customers interact with your store.
- Interactions by Type
Breakdown of actions like product search, cart add, checkout, and product view. - Conversion Funnel
Track the customer journey from search to order:- Product Search
- Product View
- Cart Add
- Order
Product Insights
- Top Searched Products
Most frequently searched keywords or products. - Top Added-to-Cart Products
Products most frequently added to cart.
Usage Patterns
- Conversations by Hour of Day
Identify peak hours when customers are most active.
You are done with the setup.